Where's the Pixel? Why Vision Models Still Struggle with Simple Pointing
Modern vision models can point to raw pixels surprisingly well, but when we started testing this capability, the results did not match what public benchmarks suggested. We stripped the problem down to its simplest form and found that even on the simplest possible tasks, models showed sharp variability.
By Maira Usman
For LLMs to successfully automate tasks on a graphical interface, they need to do one very basic thing well: know exactly where to click.
Most systems sidestep the problem with structure like selectors, bounding boxes, or accessibility metadata. At AutoDevice, we noticed something different. Modern vision models can point to raw pixels surprisingly well, interacting with interfaces the way humans do.
But when we started testing this capability, the results did not match what public benchmarks suggested. Models that ranked highly on GUI grounding benchmarks like ScreenSpot-Pro v2, PointArena, and ScreenSpot-Pro struggled in practice. We repeatedly saw out-of-bounds coordinates and clicks that missed obvious targets.
Here’s the problem: these benchmarks measure whether a model can identify the correct region or element on a screenshot—not whether it can hit the exact pixel, not whether it’s consistent across multiple runs, not whether it breaks when you change the screen size. Small spatial errors, run-to-run variance, and resolution-specific failures get buried in the final score. A model can appear reliable on these benchmarks while still producing coordinates that are completely unusable for real automation.
That gap pushed us to rethink how pixel-level grounding should be evaluated. Instead of complex computer or mobile screens, we stripped the problem down to its simplest form: small images, low resolutions, basic shapes, and clear colors. Surely, Gemini 3 will ace this?
Spoiler alert: It didn’t, at least not consistently. Even on the simplest possible tasks, whether it was pointing to a purple circle on a white background or a red square in the top-right corner, models showed sharp variability. Some were nearly perfect, while others produced large misses, out-of-bounds coordinates, or unparseable outputs, exactly the kinds of failures that would break real-world automation.
Key Findings
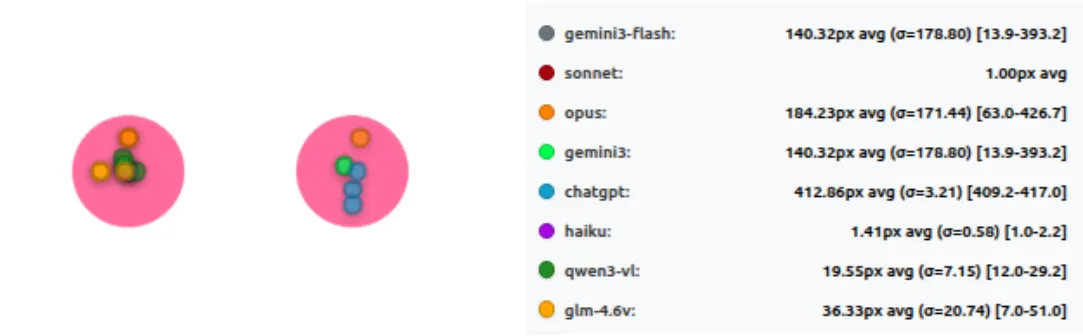
1. Simple Tasks Reveal Fundamental Gaps
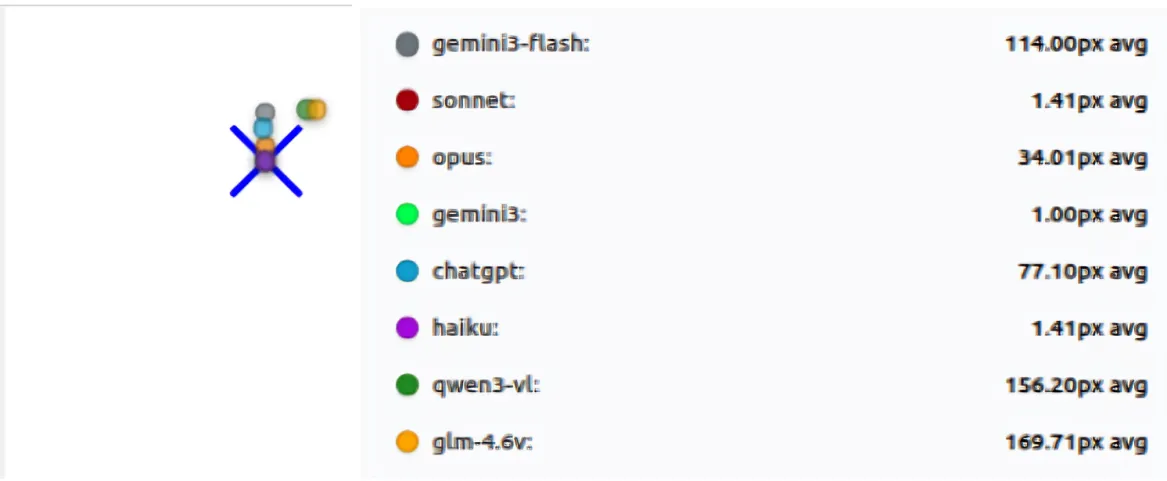
We started with the absolute basics: point to a circle. Point to a square. That’s it. Clean backgrounds, simple shapes, no distractions. The results were… revealing.
The winners: Claude Sonnet and Haiku nailed it. Sonnet averaged 1.29px of error across all tests. Haiku was right behind at 1.62px. Both were consistent: same answer every time, or close to it. Whatever these two models are doing, it’s working.
The failures: Then we looked at the others. Qwen3-VL missed by an average of 215 pixels. GLM-4.6V was off by 181 pixels. On a simple circle. On a clean screen.
Think about what that means: on a 1024-pixel screen, a 200-pixel miss isn’t a near-miss. You’re clicking a completely different part of the screen. The button you wanted is in the top-right, but you just clicked somewhere in the middle-left. That is not a small error.
Some models returned coordinates that didn’t even exist in the image. Others were consistently wrong in the same way, like they had a systematic bias hardcoded somewhere. And then there were the models that would get it right once, then completely blow it on the next run. Same image, same prompt, completely different answer.
This wasn’t happening on edge cases. This was happening on the simplest possible tests we could design.
Accuracy of models at “basic shapes” test suite
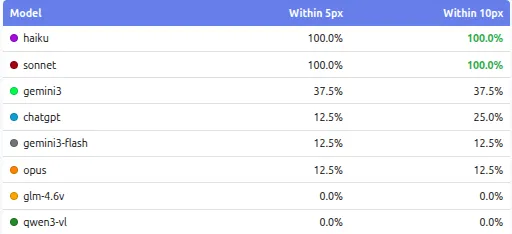
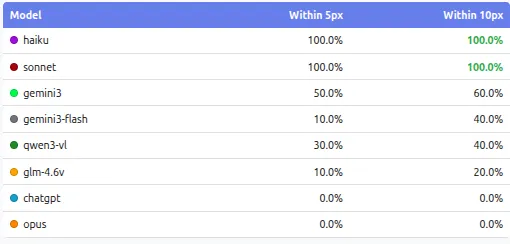
2. Consistency Across Runs is a Serious Issue
Running each test three times exposed problems that a single run would completely hide. Some models were very stable: they produced almost the same coordinates every time, with near-zero standard deviation. Others behaved very differently. On the same image and the same prompt, their clicks moved significantly between runs, sometimes landing close to the target once and far away on the next pass. This kind of multi-pass instability shows up clearly when you look at standard deviation, not just average error.
Models like Qwen3-VL and GLM-4.6V showed large standard deviations on basic tasks, meaning their predictions shifted a lot between runs. In contrast, Haiku and Sonnet were extremely consistent: low mean error and very low variance across all three runs. Models like Gemini 3 show some variance, but still large errors on several tests. So it looks like a fixed bias, not random. They kept missing in the same way, not getting it right sometimes.
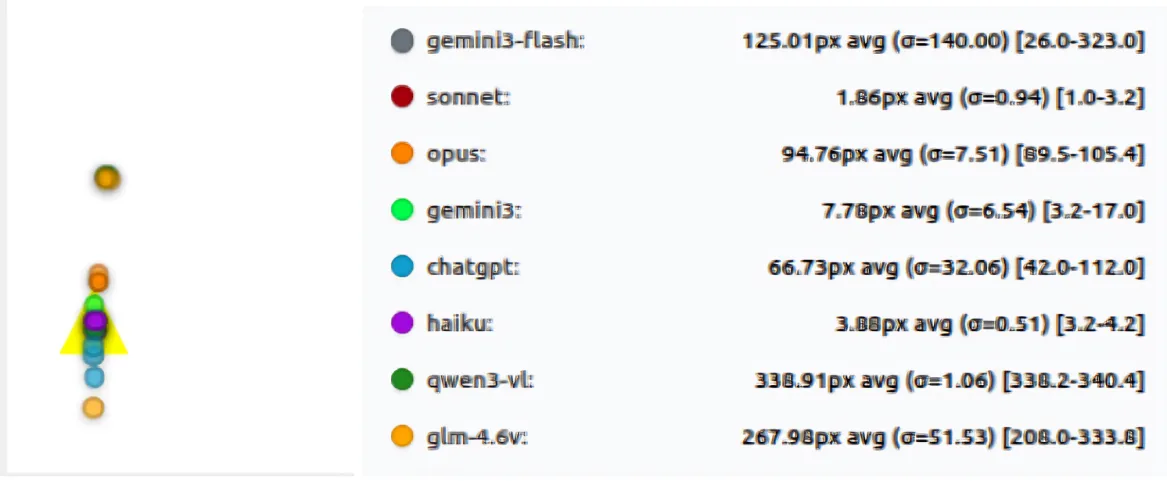
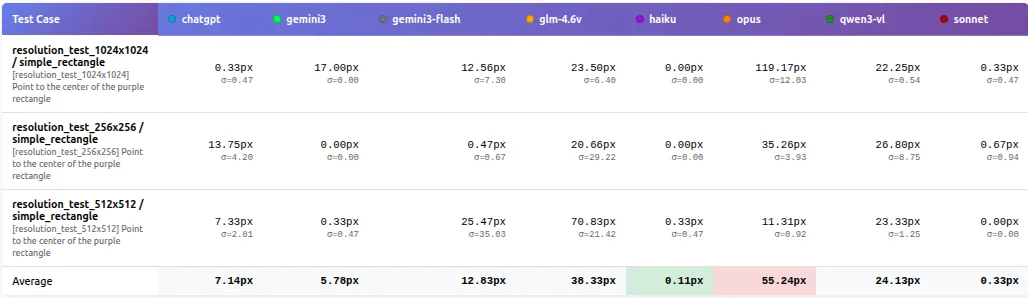
3. Resolution Matters More Than Expected
Changing resolution didn’t cause a smooth, predictable drop in accuracy. Instead, performance often flipped in step changes: a model could be perfect at one size and then miss badly at another on the same “point to the center” task. In our resolution test, 1024×1024 was near-perfect for some models, while 512×512 produced ~70-100px misses across multiple models.
This also highlights that resolution and aspect ratio are part of the task. A model that works well at one device profile can’t be assumed to behave similarly at another, even when the image looks simple.
What the results show:
Sonnet and Haiku stay near-perfect (≈0–1px) across 256×256, 512×512, and 1024×1024.
In contrast, several models behave non-monotonically:
- ChatGPT is ~10px at 256×256 and ~25px at 1024×1024, but jumps to ~133px at 512×512
- GLM-4.6V shifts from ~7.5px (256×256) to ~84px (512×512) and back to ~19px (1024×1024)
- Qwen3-VL similarly improves at higher resolution (~28px at 256/512 → ~8px at 1024)
Comparison between different resolutions
4. The Surprise Winner: Smaller Can Be Better
The results also challenged the assumption that larger models are always better. Here’s what shocked us: Claude Haiku, the smaller and cheaper model, matched Sonnet’s performance (1.62px vs 1.29px error) on several key suites, including basic_shapes and color_identification, while costing a fraction of the price. When performance is normalized by cost, smaller and more consistent models can offer better accuracy per dollar.
For real deployments, this matters more than peak benchmark scores. Predictable behavior and controlled cost often outweigh marginal gains in raw capability.
Bigger models aren’t automatically the safest choice
5. Color and Shape Discrimination Have Clear Limits
Tasks that require choosing between similar options exposed sharp limits in model perception. In color_identification, models often performed perfectly on basic colors, giving the impression that the problem was solved. Once the task shifted to subtle color differences, performance dropped quickly for many models. Failures here were usually wrong-target selections rather than small positional errors.
Performance of models at “color identification” test suite
The same pattern appeared in shape_identification. When shapes were visually distinct, most models performed reasonably well. When shapes became confusable, such as polygons with similar numbers of sides, results separated sharply. Some models remained reliable, while others consistently failed every test in this category during the run.
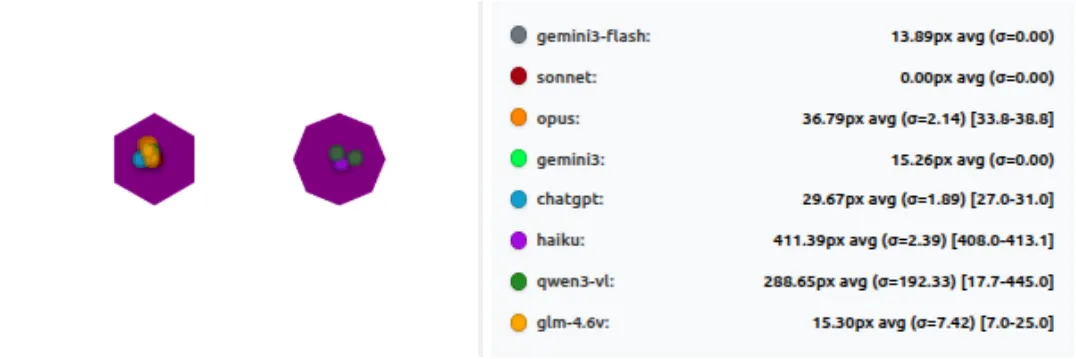
When Shapes Get Similar, Pixel-Perfect Clicking Breaks
Wrapping Up
All these tests point to one clear thing: even the best vision models today are not as reliable at precise pointing as we might think from big benchmarks.
Claude Sonnet and Haiku come out on top, staying accurate and consistent even when we change resolution or make shapes harder to tell apart. Most others struggle with big misses, wild variation between runs, or sudden drops when screen size changes. For real world agents, where every click has to land right, these gaps matter a lot.
Ben Anderson nailed this in his analysis of computer use benchmarks (https://benanderson.work/blog/computer-use-benchmarks/) scores swing wildly based on small prompt changes. A model that scores low in one format might score much higher in another. Those high-level numbers don’t tell the full story about precise control.
This matches what Anthropic shared in their post “Developing a computer use model”:
“Claude looks at screenshots of what’s visible to the user, then counts how many pixels vertically or horizontally it needs to move a cursor in order to click in the correct place. Training Claude to count pixels accurately was critical.”
Perhaps Claude’s accuracy is in the fact that it has learned the skill from ground-up and it has a methodology around solving the problem, instead of being driven through RL-environments, and being expected to imitate in the real world.
We built and open sourced PixelPointingBenchmark to make this easy to check and improve. It’s simple to run, extend, and compare new models.
Link: https://github.com/autodevice/PixelPointingBenchmark
If you give it a try or find something interesting, share your results. Better pixel grounding will make screen agents way stronger for everyone.
For a deeper dive into methodology, detailed statistics, and technical analysis, see Part 2: The Technical Deep Dive.