Where's the Pixel? The Technical Deep Dive
This is Part 2 of our analysis. We strip away complex screenshots and test vision models on the simplest possible tasks - pointing to shapes on clean backgrounds. The results reveal fundamental gaps in spatial reasoning that benchmarks miss.
By Maira Usman
This is Part 2 of our analysis. Read Part 1 here for the high-level findings and why this matters.
How We Measured This
We wanted to answer a simple question: can these models actually return the right (x, y) coordinate when you ask them to point to something?
The problem with most benchmarks is they’re testing too many capabilities of the model with real app screenshots. A model fails on a complex screenshot and you have no idea why. Did it not see the button? Did it see it but point to the wrong pixel? Did it misunderstand the coordinate system? Too many things could have gone wrong.
So we built our own images. Programmatically generated shapes on clean backgrounds. We know exactly where the center of every circle is because we drew it there. When a model says the center is at (500, 500) but we know it’s at (409, 728), that’s not a “couldn’t find it” problem. That’s a spatial reasoning problem.
Why Start Simple?
We started with a single purple circle on a white background. That’s it. If a model can’t point to that, forget about real UIs.
Then we added complexity one thing at a time. Multiple shapes, subtle color differences, similar polygon shapes that looks almost the same. Size comparisons where difference is barely visible, different resolutions. Each step tests one specific thing so we know what exactly went wrong.
What We Tested
We built five test suites:
- Basic Shapes: Circles, squares, triangles in different positions. The absolute basics.
- Color Identification: Start with basic colors, then get into hexcode-level differences. Can the model tell #FF6B9D from #FF6B9E?
- Shape Identification: Circle vs square is easy. Hexagon vs octagon? That’s where things get interesting.
- Size Comparison: Find the bigger shape. Then make them almost the same size and see what breaks.
- Resolution Tests: Same simple task at 256×256, 512×512, and 1024×1024. Does performance degrade smoothly, or does it suddenly break at a specific size?
We tested 8 models—everything from big expensive ones like Claude Opus and GPT-5.2 to smaller cheaper ones like Haiku and Gemini 3 Flash. Each test runs three times so we can see if a model is consistent or just occasionally lucky.
The Prompt
The prompt we gave to every model was the same simple one:
Point to the center of the purple rectangle
Image dimensions: 1024 pixels wide × 1024 pixels tall.
Coordinate system: The top-left corner is (0, 0) and (1024, 1024) is the bottom-right.
Respond with only the coordinates in the format: (x, y)
(We’d change “purple rectangle” to match whatever shape we were testing, but the format and coordinate instructions stayed the same.)
Running each test three times was key. It showed us two completely different failure modes: models that are consistently wrong (always clicking 89 pixels to the left) versus models that are wildly inconsistent (right one run, 200 pixels off the next). Standard deviation makes that difference visible.
We also tested different resolutions and aspect ratios because real devices come in all shapes and sizes. Turns out that matters way more than we expected.
Everything’s open source: https://github.com/autodevice/PixelPointingBenchmark. Clone it, run your own tests, add new models. The code generates the images, calls the APIs, and spits out the same tables we used.
The Failure Modes: When Simple Tasks Break
Simple Tasks Reveal Fundamental Gaps—And Catastrophic Failures
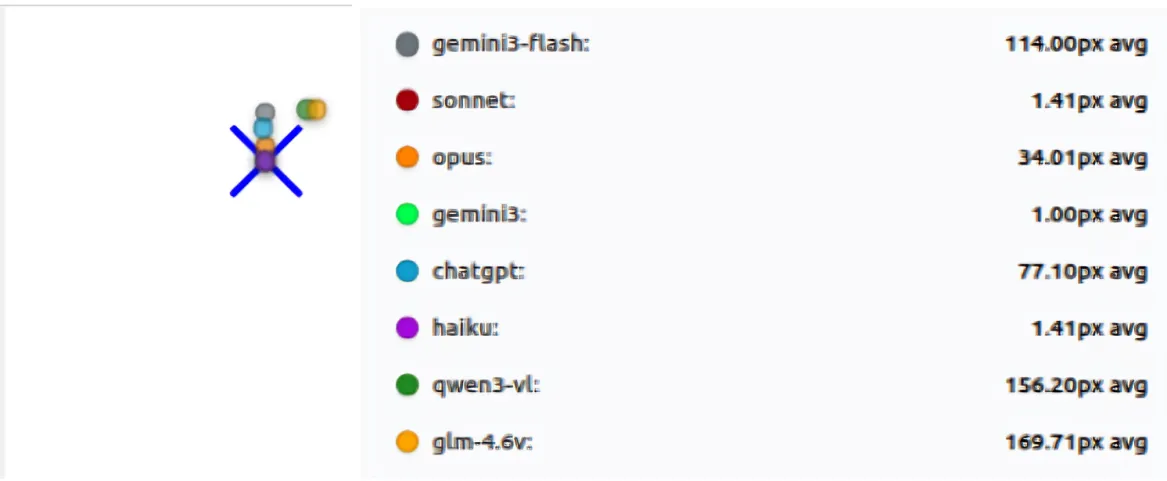
In the simplest test (Basic Shapes), the results immediately separated the reliable models from the unstable ones. Claude Sonnet and Claude Haiku demonstrated exceptional consistency, maintaining mean errors of 1.29 px and 1.62 px, respectively, with minimal variance (standard deviations below 1 px).
Conversely, models like Qwen3-VL and GLM-4.6V were off by huge margins, averaging over 180 pixels of error. These failures were not small misses; they were catastrophic misses on clean screens. On a 1024-pixel screen, a miss of over 200 pixels means the model is clicking in a completely different region—the kind of error that would break any real-world automation workflow.
Here’s the full breakdown across 8 tests, 3 passes each:
| Model | Mean distance (px) | Avg σ across tests (px) | Max σ on any test (px) | Tests w/ data |
|---|---|---|---|---|
| sonnet | 1.29 | 0.55 | 1.70 | 8 |
| haiku | 1.62 | 0.14 | 0.58 | 8 |
| opus | 50.91 | 3.56 | 12.89 | 8 |
| chatgpt | 56.69 | 18.08 | 45.99 | 8 |
| gemini3 | 89.26 | 27.62 | 106.77 | 8 |
| gemini3-flash | 113.66 | 54.31 | 140.00 | 8 |
| glm-4.6v | 181.33 | 44.94 | 190.45 | 8 |
| qwen3-vl | 215.79 | 23.03 | 115.74 | 8 |
Table shows mean error and standard deviation across three runs for each model on the basic_shapes suite.
Key observations:
- Haiku and Sonnet show exceptional consistency: mean error < 2px with σ < 1px
- Gemini3-Flash has the highest variability (avg σ = 54.31px, max σ = 140.00px)
- GLM-4.6V and Qwen3-VL have high mean errors (>180px) with moderate variability
- ChatGPT shows moderate error (56.69px) but significant variability (max σ = 45.99px)
- Gemini3 shows zero variance on many tests but consistently large errors (~89px), indicating stable but wrong predictions
The gap between the best (Sonnet at 1.29px) and worst (Qwen3-VL at 215.79px) is staggering—a 167x difference in accuracy on the same simple tasks.
Consistency Across Runs: Two Types of Failure
Running each test three times exposed a critical distinction: there are two completely different failure modes, and standard deviation makes both visible.
Type 1: Stable but Wrong
Models like Gemini 3 Pro show near-zero variance on many tests but still produce large errors (~89px mean). This indicates they’re consistently locking onto the incorrect spot—a systematic bias rather than random guessing. They’re confidently wrong, which is actually worse for automation than being occasionally right. If a model always clicks 89 pixels to the left of the target, you can’t fix it with retries; you need to correct for the bias.
Type 2: Wildly Unstable
Models like Gemini 3 Flash and GLM-4.6V show the opposite problem: high variability (average σ = 54.31px and 44.94px respectively) combined with high mean errors. Gemini 3 Flash’s worst-case standard deviation reaches 140.00px on a single test, meaning its predictions can swing wildly between runs—sometimes close, sometimes catastrophically far. This is the “guessing” pattern: the model isn’t grounded in the visual anchor, so it produces different answers each time.
Resolution Matters: Step-Change Failures, Not Gradual Drift
Changing resolution didn’t cause a smooth, predictable drop in accuracy. Instead, performance often flipped in step changes—like a breaking change in software, where something that worked perfectly at one size suddenly fails catastrophically at another.
The Heroes: Stable Across All Sizes
Sonnet and Haiku are essentially 0–1px at 256×256, 512×512, and 1024×1024. They don’t care about resolution; they just work.
The Step-Change Collapse: ChatGPT’s 512×512 Mystery
ChatGPT demonstrates the most dramatic example of non-monotonic failure. At 256×256, it’s off by ~10px—not great, but usable. At 1024×1024, it’s ~25px off—still manageable. But at 512×512, it jumps to ~133px off, a catastrophic failure that appears out of nowhere. This isn’t gradual degradation; it’s a sudden collapse at a specific resolution. The same prompt, the same visual task, but a completely different outcome.
Resolution-Sensitive Drift: GLM-4.6V’s Roller Coaster
GLM-4.6V shows a different pattern: single-digit accuracy (~7.5px) at 256×256, then a sharp degradation to ~84px at 512×512, followed by recovery to ~19px at 1024×1024. This non-monotonic behavior suggests the model has resolution-specific processing quirks that create breaking points.
The Counter-Intuitive Improvement: Qwen3-VL
Qwen3-VL does something unexpected: it performs worse at lower resolutions (~28px at 256/512) but improves at higher resolution (~8px at 1024). This suggests that for some models, more pixels actually help, but you can’t predict which models will benefit.
Takeaway: Resolution changes can behave like a breaking change for some models. You can’t assume that a model that works well at one resolution will behave similarly at another—even when the image is simple and the prompt is identical.
Subtle Discrimination Failures: When “Close Enough” Isn’t Close Enough
Tasks that require choosing between similar options exposed sharp limits in model perception. The failures here are different from spatial accuracy failures—they’re perceptual failures where the model selects the wrong target entirely.
Color Identification: The Hexcode Cliff
In color_identification, models often performed perfectly on basic colors (red, blue, green), giving the impression that the problem was solved. Once the task shifted to subtle color differences—like distinguishing hexcode #FF6B9D from #FF6B9E (a single-digit difference in one color channel)—performance dropped quickly for many models. Failures here were usually wrong-target selections rather than small positional errors. The model would confidently point to the wrong circle, not because it couldn’t find the center, but because it couldn’t distinguish the colors.
Shape Identification: When Polygons Become Confusable
The same pattern appeared in shape_identification. When shapes were visually distinct (circle vs square), most models performed reasonably well. When shapes became confusable, such as polygons with similar numbers of sides (hexagon vs octagon, decagon among circles), results separated sharply. Some models remained reliable, while others consistently failed every test in this category during the run.
This shows that model “perception” still has hard limits, even when the click location itself is obvious. If a model can’t tell a hexagon from an octagon, it doesn’t matter how good it is at pixel-level accuracy—it will click the wrong shape.
Surprising Winners: Smaller Models Can Be Better
The results challenged the assumption that larger models are always better. Claude Haiku, being smaller and cheaper, performed almost as well as Sonnet (1.62 px mean error vs 1.29 px, with σ = 0.14 px vs 0.55 px). For real deployments, predictable, cheap accuracy is often superior to expensive, inconsistent high-level performance.
When performance is normalized by cost, smaller and more consistent models can offer better accuracy per dollar. This matters more than peak benchmark scores because predictable behavior and controlled cost often outweigh marginal gains in raw capability.
Model-by-Model Analysis
Claude Sonnet 4: The Gold Standard
Claude Sonnet was the strongest model in this benchmark. It achieved extremely high accuracy, with a mean error of just 1.29 pixels, and showed very strong consistency across runs, with an average standard deviation of 0.55 pixels. Its predictions were stable across all test suites and resolutions. In these experiments, Sonnet was the most reliable model overall.
Claude Haiku 4.5: The Surprise Winner
Claude Haiku performed almost as well as Sonnet. Its mean error was 1.62 pixels, and it showed even lower variance across runs, with an average standard deviation of 0.14 pixels. Despite being a smaller and cheaper model, it matched or exceeded larger models on most tasks, making it one of the most impressive performers in this evaluation.
Claude Opus 4.5: Reliable but Not Precise
Claude Opus showed moderate accuracy, with a mean error of 50.91 pixels and relatively good consistency across runs. Its average standard deviation was 3.56 pixels. While it was generally reliable, it did not reach the same level of pixel precision as Sonnet or Haiku.
GPT-5.2: The Resolution Mystery
GPT-5.2 showed moderate average accuracy, with a mean error of 56.69 pixels, but its behavior was inconsistent. The model had a relatively high average standard deviation of 18.08 pixels, with some tests reaching nearly 46 pixels of variance. It also showed clear resolution-specific failures, including a large error of around 133 pixels at 512×512 resolution. Overall, its predictions varied significantly across runs.
Gemini 3 Pro: Confidently Wrong
Gemini 3 Pro displayed an unusual pattern. Its mean error was high, around 89 pixels, but its variance was near zero on many tests. This suggests the model was not guessing randomly, but instead producing stable, repeatable outputs that were consistently wrong. In other words, the model locked onto incorrect locations rather than properly grounding the target.
Gemini 3 Flash: Wildly Unpredictable
Gemini 3 Flash struggled on both accuracy and consistency. It had a high mean error of 113.66 pixels and showed very large variance across runs, with an average standard deviation of 54.31 pixels and peaks as high as 140 pixels. Among all models tested, it was the most unstable and unpredictable.
Qwen3-VL
Qwen3-VL had the highest mean error in the benchmark at 215.79 pixels. Its average standard deviation was 23.03 pixels, indicating noticeable run-to-run variation. While it struggled across most test suites, it did show some improvement at higher resolutions, suggesting sensitivity to image scale.
GLM-4.6V
GLM-4.6V performed poorly overall, with a mean error of 181.33 pixels and high variability across runs. Its average standard deviation was 44.94 pixels, and in some tests, such as simple_circle, the standard deviation reached as high as 190.45 pixels. This behavior strongly resembles guessing rather than grounded visual reasoning.
Technical Implications
For Automation Systems
Models that score well on benchmarks should not be trusted blindly. Several models that appeared strong elsewhere failed on very simple pointing tasks in this evaluation. Resolution and aspect ratio also turned out to be critical. Models behaved very differently on mobile-style tall images compared to square ones, and performance could collapse when resolution changed even slightly.
Because of this variability, any system that depends on pixel-accurate outputs needs redundancy, such as retries or validation checks. Explicitly providing image dimensions and coordinate systems helps, but it does not fully solve the problem. Some models still struggle with spatial reasoning at a more fundamental level.
Simple tests are especially revealing. If a model cannot reliably point to a purple circle on a clean background, it is unlikely to perform well on dense or complex interfaces.
For Model Evaluation
These results suggest that pixel-level accuracy should be evaluated separately from high-level task success. A model may correctly identify the intended UI element but still return coordinates that are unusable in practice.
Looking only at average error hides important failure modes. Standard deviation across multiple runs is equally important, because it shows whether a model is truly grounded or just occasionally correct. Models that appear similar in average accuracy can behave very differently once consistency is taken into account.
Future Work
This benchmark is only a starting point. We plan to explore more challenging edge cases, such as overlapping shapes, transparent elements, and low-contrast targets. We also want to test how sensitive models are to different instruction phrasings for the same task, and whether they can handle more complex comparisons like choosing the larger of two nearly identical shapes. Finally, we aim to connect these synthetic results to real-world performance on actual mobile screenshots, where layout noise and visual clutter are unavoidable.
Conclusion
When we started this project, we expected simple pointing tasks to be largely solved. Instead, we found a more nuanced picture. Some models are extremely good at pixel-level pointing, while others fail in ways that are not obvious from standard benchmarks.
The gap between benchmark scores and real reliability is not just about task complexity, but about fundamental spatial capabilities that are still uneven across models. By starting with the simplest possible tests and measuring consistency directly, we can expose these gaps early and better understand what current vision-language models can and cannot do.
Try the benchmark yourself: https://github.com/autodevice/PixelPointingBenchmark